
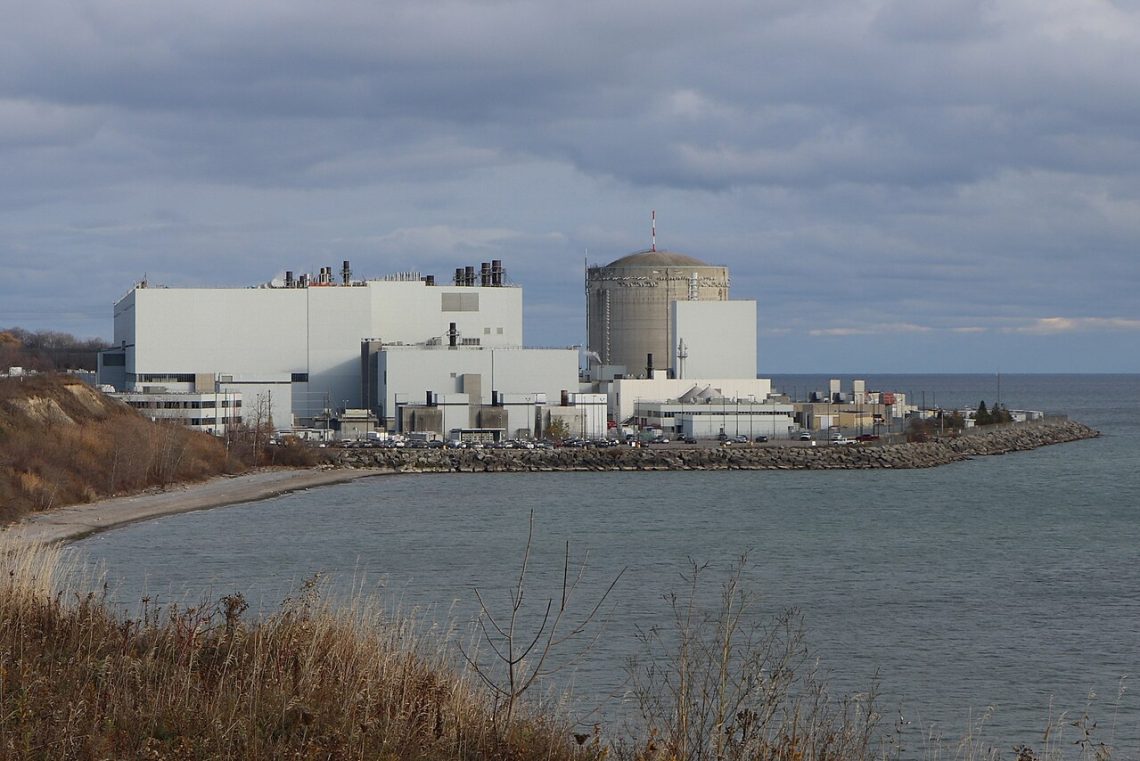
In energy debates, “intermittency” is a term almost always reserved for wind and solar. Their output rises and falls with the weather and the sun, forcing system operators to balance short‑term fluctuations with flexible generation, storage, and demand response. Nuclear power, by contrast, is usually framed as the antithesis of intermittency: steady baseload, always on, always there.
Yet Ontario’s experience with nuclear power tells a more complicated story—one in which intermittency appears not in minutes and hours, but in decades.
Ontario’s fleet of CANDU-powered steam generators has defined the province’s electricity system for half a century, providing the bulk of its low‑carbon generation. When they are working, they have high capacity factors.
However, the history of Ontario’s nuclear program is punctuated by multi‑year shutdowns, premature rebuilds, and refurbishment campaigns that have temporarily removed gigawatts of capacity from the grid. These long, deep outages are not mere maintenance windows; they are structural breaks in supply that shape both the cost and reliability of the system.
Related Story: Ontario’s Latest Nuclear Megaproject Confronts Soaring Cost Concerns
This is a different kind of intermittency than that of wind or solar; it is a deeper, more intractable loss of dispatchability. Variable renewables are constrained by nature in real time; their variability is weather‑driven and randomly determined, on short time scales. Nuclear’s intermittency in Ontario arises from the life cycle of complex megaprojects and the challenges of aging CANDU technology. When pressure tubes degrade faster than expected, when refurbishment projects run over schedule or encounter unforeseen technical hurdles, the system faces not a brief lull in output but years of missing capacity. The lights stay on because gas, hydropower, imports, and demand‑side measures fill the gap, but the economic and planning consequences are profound.
This deeper type of intermittency operates on the scale of decades. Reactors are added in large blocks and then, years later, removed from service for prolonged rebuilds and sometimes premature retirement. These stepwise changes in capacity create long waves of surplus and deficit. In the surplus years, nuclear runs flat out, masking underlying risks. In the deficit years, consumers absorb the cost of replacement energy, new capacity, and refurbishment overruns, even as nuclear output drops. The result is a system whose apparent reliability rests on a foundation of long‑cycle volatility that is easy to overlook if we focus only on hourly dispatch.
If we broaden our understanding of intermittency beyond weather and hours, we can see Ontario’s nuclear history as a case study in infrastructure intermittency: the tendency of large, capital‑intensive assets to fail, be repaired, or be rebuilt in big, lumpy episodes rather than smooth, gradual adjustments. Planning around this requires redundancy, diversification, and flexibility—much the same toolkit invoked to handle renewable variability, but deployed over different time scales and with different financial consequences.
Ralph Torrie is director of research at Corporate Knights. His LinkedIn post is republished here with permission.



 Kim deLagran


Thanks for this article. I am wondering how activists can utilize this info in an easily explained way. Are there graphs or charts that show how Ontario’s nuclear power supply fluctuates and causes other energy modalities to be used over the life span of our chain of reactors? If these fluctuations can be graphed…maybe the cost per KWH can be shown to be in lockstep with nuclear reactor repairs and increase use of fossil gas generators. However just to visually see the power output fluctuations from nuclear generators on a graph would be very useful.